12 września 2020 by Tadeusz Balcer
Displaying a map with list of points in Databricks notebook
Have you ever wanted to display a map in a Databricks notebook? You can do it easly by using folium library in Python.
The notebook with working code can be found in my github repository. First, you need to install folium library:
dbutils.library.installPyPI("folium")Next, you just need to import libraries, add points to folium map and display it:
import folium as folium
import math as math
import pandas as pd
result_pdf = df.select("*").toPandas()
map_position = result_pdf[["Latitude", "Longitude"]].iloc[1,:]
map = folium.Map(location=[map_position["Latitude"], map_position["Longitude"]], zoom_start=11)
result_pdf.apply(lambda row:
folium.CircleMarker(
location=[row["Latitude"], row["Longitude"]],
radius=5,
popup=f'{row["Id"]}'
).add_to(map), axis=1)
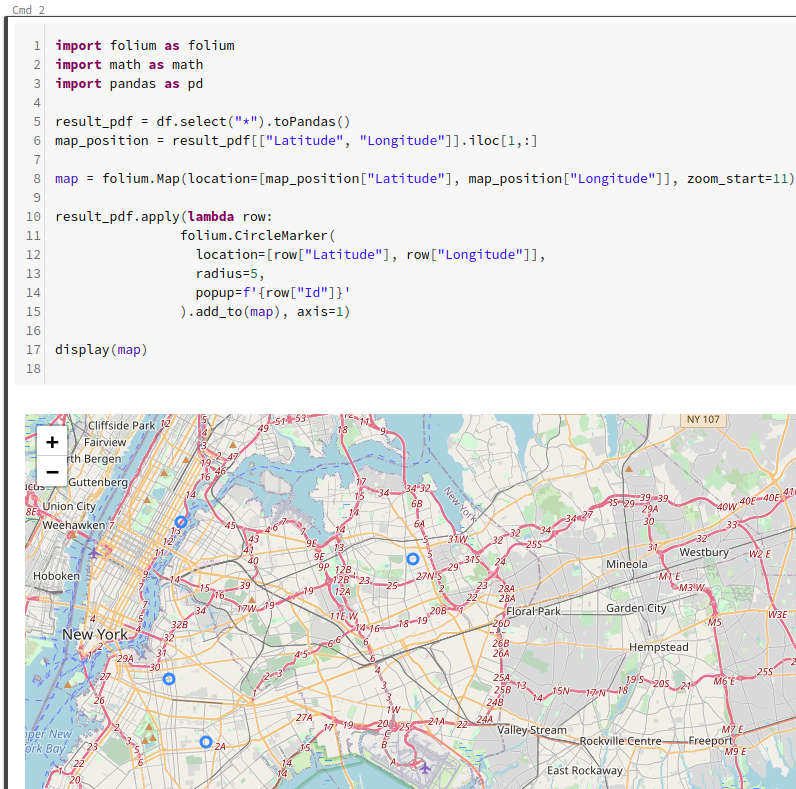
display(map)
And here is the map!